WordPress Kubernetes Deployment with Helm & Monitoring
Production-ready WordPress stack on Kubernetes with Prometheus & Grafana monitoring
A comprehensive Kubernetes deployment project featuring containerized WordPress, MySQL, and Nginx services deployed using Helm charts. Includes persistent storage, reverse proxy configuration, and full observability stack with Prometheus metrics collection and Grafana dashboards for real-time monitoring and alerting.
Tech Stack
The engine behind the experience
OVERVIEW
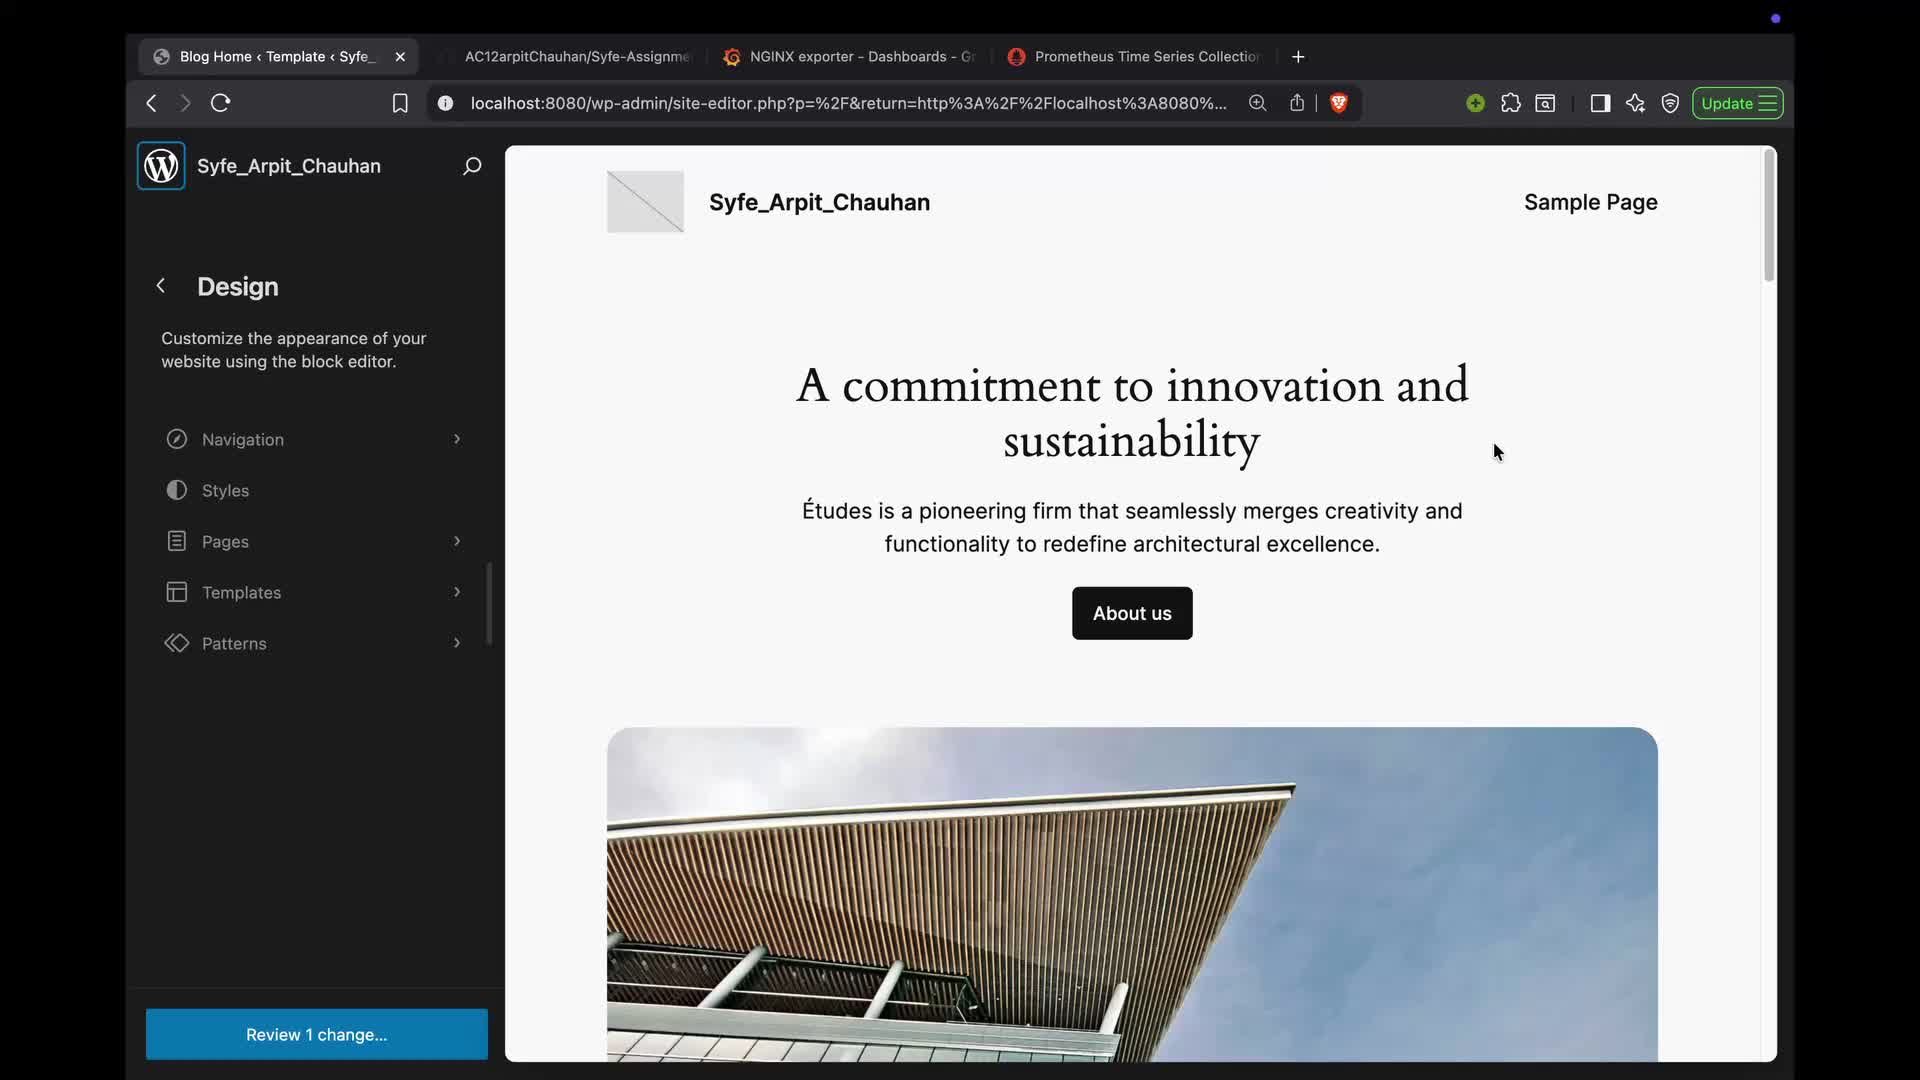
A complete end-to-end DevOps project demonstrating production-grade Kubernetes deployment practices. The project encompasses containerization of a WordPress application stack, Kubernetes orchestration, Helm chart development, and comprehensive monitoring integration. The system consists of three core services: WordPress (PHP-Apache), MySQL 8.0 database, and Nginx (OpenResty) reverse proxy. Each service is containerized with custom Dockerfiles, tested locally using Docker Compose, and then deployed on Minikube using Kubernetes manifests. Key features include custom Docker image builds for all services with optimized configurations, Kubernetes deployments with proper resource management and health checks, persistent volume claims (PVCs) for data persistence ensuring WordPress content and MySQL data survive pod restarts, Helm chart packaging for simplified deployment and configuration management with templated values, Nginx reverse proxy setup with OpenResty compiled from source for Lua support and advanced routing capabilities, Prometheus integration for metrics collection from pods, services, and Nginx exporter, Grafana dashboards for visualizing CPU, memory, request rates, and error metrics, custom Prometheus alerting rules for high CPU usage, pod failures, and Nginx error rates, ServiceMonitor configuration for automatic metric discovery, and comprehensive documentation with step-by-step deployment instructions. The project follows Kubernetes best practices including proper secret management for database credentials, persistent storage with ReadWriteOnce (RWO) volumes, service discovery and networking, and resource isolation. The monitoring stack provides real-time insights into pod health, resource utilization, HTTP request patterns, and system performance, enabling proactive issue detection and capacity planning. Built as a learning assignment, this project demonstrates proficiency in container orchestration, infrastructure as code, observability, and cloud-native application deployment patterns.


